


 Publications
 Partners


Technical analysis is one half of the first four pillars on which successful trading rests, as I mentioned in the first article of this series. (24 January edition.)
It is therefore our starting point, but we won’t jump straight into the complicated stuff just yet.
We’ll start at the beginning.
The trend. A market trend is a sustained directional movement in the price of a security (see sidebar) over time.
A good example is the Naspers* share price.
Over the last two decades or so, the price of Naspers shares has been steadily rising.
Even though over the last year or so the price has come down quite a bit, the overall price trend for Naspers shares over a 20-year timeframe is up.
When the price of a security is in a rising trend, it is said to be in a bull trend.
Conversely, when the price of a security is in a falling trend, it is said to be in a bear trend.
Therefore, over the long run, Naspers has been experiencing a strong bullish trend.
The three phases of trends:
1. The “main movement”, primary trend, or major trend.
This is the overall direction of the price movement over longer periods of time.
Major trends can last from a bit less than a year to several years and they can be either bullish or bearish.
2. The “medium swing”, secondary reaction/trend, or intermediate reaction/trend.
These are shorter-term price movements that move in the opposite direction to the major trend and can last anything from ten days to three months.
Secondary trends can retrace from 33% to 66% of the trend price change since the previous secondary trend, or start of the main movement.
3. The “short swing”, or minor movement, or tertiary trend lasts (with some varying opinions on the topic) from a few hours to a month or more.
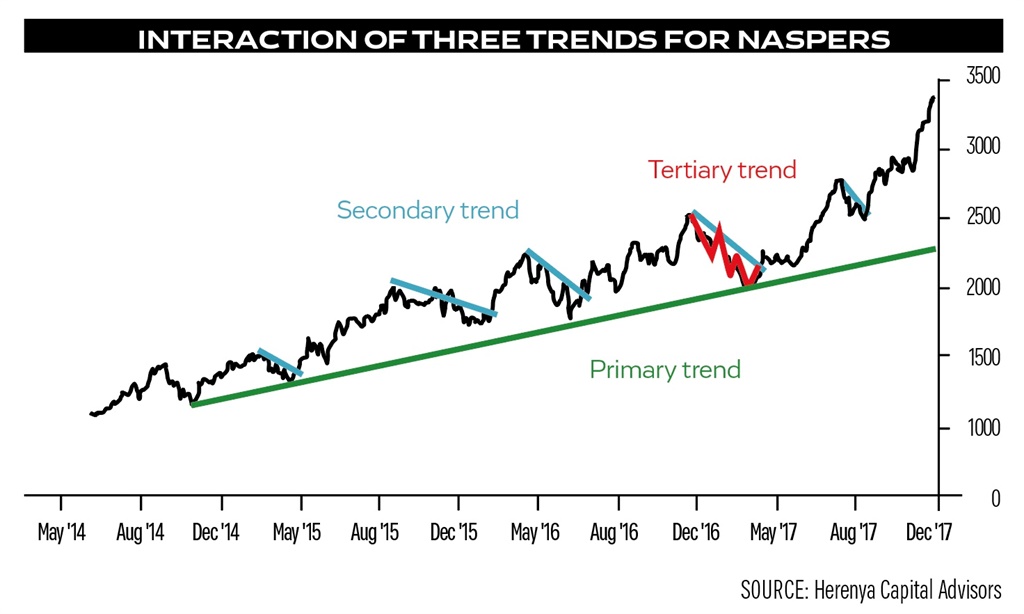
The Naspers graph illustrates how the three different types of trends interact with each other.
By looking at the graph, we can see that the primary trend is up, as the share price is rising over time.
However, within this primary bullish trend there are periods when the price comes down.
These are the secondary trends that form within the primary trend. Looking even deeper we can see that within the secondary trends, there are short periods during which the price is either coming down or moving up.
These are tertiary trends that only last for short periods of time.
We can also see from the graph that all three trend types exist at the same time.
Thus, we can have a bullish tertiary trend, in a bearish secondary trend, in a bullish primary trend.
Great stuff! Now we know the basics of how trends work, but why is this important?
Well, a general rule is to never trade against the trend.
So, the first step is to identify what the primary trend is in a security.
You don’t have to go back and look at 20 years of price data; about three to five years’ worth should do the trick.
To be on the very safe side, a trader would opt to not trade in the opposite direction of the primary trend.
In other words, if the trend is bullish, only go long (buy with the objective to sell at a higher price).
Conversely, if the primary trend is bearish, only go short (sell with the objective of buying back at a lower price).
The purpose of trend analysis is to find the turning points when secondary trends end and primary trends continue.
Those are the points at which the probability of entering a successful trade is the highest.
More aggressive traders would look to trade the tertiary trends within the secondary trends, although this is a more active trading approach and is riskier.
Remember, great traders never take more risk than they can afford, or so much that irreparable damage is done to their portfolios.
Petri Redelinghuys is a trader and the founder of Herenya Capital Advisors.
*finweek is a publication of Media24, a subsidiary of Naspers.
This article originally appeared in the 7 February edition of finweek. Buy and download the magazine here or subscribe to our newsletter here.


