


 Publications
 Partners


In any form of analysis, history is a great indicator, but as much as it allows one to join the dots, the future remains the unknown. Just watch Steve Jobs’ 2005 commencement speechat Stanford University for some insight into this concept.
Ted Black is a mentor and coach to executives and managers, and he uses the ROAM model (Return-on-Assets Managed) to pinpoint opportunities or challenges. In the piece below he draws comparisons between Didata and Naspers. Black refers to the classic Jean-Baptiste Alphonse Karrsaying: “The more things change, the more they stay the same.”
And he wonders, if given this reference to history, when the tide recedes, will Naspers be caught with a swimming costume on, or stand naked like Didata did when the dotcom frenzy hit investors in 2000? Interesting analysis. – Stuart Lowman
By Ted Black*
After reading Alec Hogg’s interview with Bob van Dijk, CEO of Naspers, who clearly faces some big issues, a few lines in my last article about the Pollyanna Principle and power of optimistic bridge building come to mind.
Do not overdose on Pollyanna strategy. Murphy is always at your shoulder ready to strike. You need daily doses of common sense backed with skills in Pollyanna Productivity and Pollyanna Profitability to counter him.
Reminding can be far more useful than new information. We seem to repeat the same mistakes again and again but in a different guise. We live and don’t learn. Looking at Naspers latest numbers reminds me of Didata at the height of the dotcom frenzy in 2000. Though very different firms, aren’t they also the same in more than one way?
Research of thousands of companies worldwide during the 1970s by the Strategic Planning Institute produced a database called PIMS (Profit Impact of Market Strategy). One of its key findings was that Asset Turnover (ATO), the sales productivity of a firm’s asset base, has a profound effect on profitability and the ROAM (Return on Assets Managed) of a company.
This chart summarises it:
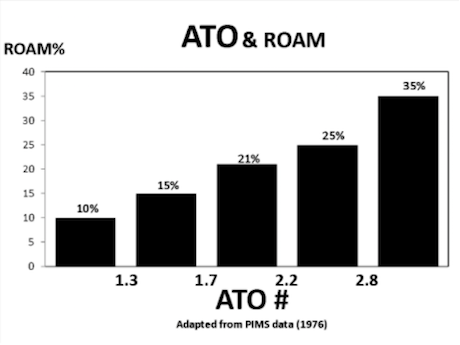
With ATO, the lower the number, the lower your ROAM% is likely to be. If you have an ATO of less than 1.0 you are likely to generate a ROAM of 10% or less. The higher it is, the higher the probability of a better return.
Before Didata’s market value collapsed in 2001, its ATO reached a low of 34 cents of sales for every $ of assets. Two years earlier, its management had generated $1.74 for every $ of assets on the balance sheet and a Cash ROAM of 21%. It then plummeted to 1.6%.
One of the rules of the ROAM management system is to always judge trends – not isolated numbers, so let’s look at some. The first is ATO (Sales ÷ Assets).
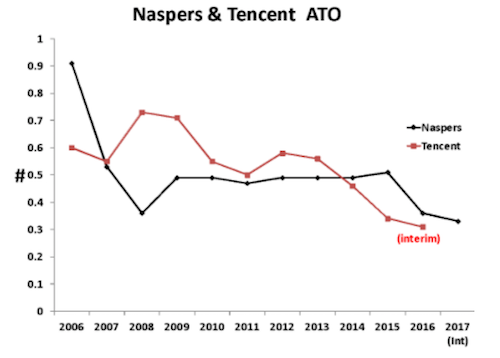
Both Naspers and Tencent are highly asset intensive and show declining ATO trends. At the last interim stage Tencent’s ATO was 0.31 and Naspers 0.33.
Both are very low but can be countered with a high Return on Sales (ROS%) that’s sustained with low costs or an ability to charge premium prices because of high quality. Tencent does generate a high ROS% as the chart below shows, but in a highly competitive market, it’s hard to sustain unless rooted in high productivity.

Tencent has a 52% ROS but Naspers’ ROS is only 3%. This raises questions.
With Naspers latest half-year results, Tencent accounted for 50% of sales revenue, more than 100% of Trading Profit and 93% of EBITDA and the numbers have risen since last year-end. What does that tell you about the productivity of the rest of the Naspers asset base?
ROAM demands you apply the 80/20 Rule for diagnosis and action. In 2000, 94% of Didata’s asset base generated only a 2% ROAM. If so much of Naspers’ profit comes from Tencent, then how is the rest of its asset base performing? The segmental reporting allocates no assets to enable you to judge.
As the next chart shows, Naspers’ Operating Cash Return on Assets is down to 1% – the result of huge growth of the asset base relative to sales and a Cash ROS that has fallen from 28% in 2010 to today’s 3%.

Tencent’s Cash ROAM is now 16%. It was 51% in 2009. Despite these trends, the market values of both companies continue to rise, which brings to mind a different, but little used measure.
In the late 1990s, at the height of the dotcom boom, Adrian Slywotsky published a book called “Value Migration”. His message was that competitive marketplace forces shift value. It migrates from outdated business models to new ones. Bob van Dijk terms them “Platforms” in today’s internet business lingo. The language used in the dotcom era was also rather opaque.
Slywotsky’s measure is Market Cap ÷ Sales Revenue. If the number is higher than 2.0, market value is flowing in. Anything between 1.0 and 2.0 reflects stability and less than 1.0 means value is flowing out. Naspers’ number is 12.7. The capital markets value the firm at nearly thirteen times its sales revenue. That’s higher than Tencent at 10.2.
This is how both firms compare with Didata at its height.

Didata reached a market value peak of 5.4 times its sales revenue in 2000. Then it collapsed to a low of 0.15. That’s when its Cash ROAM fell to 1.9% after a height of 27% in 1997. Until it was sold, Didata never got beyond a Sales: Market Cap ratio of 0.5. Market value drained away never to return even though management did eventually generate a reasonable ROAM.
Naspers and Tencent are very different from Didata but all three focus on the internet. As Tencent’s user base puts it into the big league of internet players, let’s next compare some of their market value ratios.

Facebook leads the way at 16.9 with Naspers even higher than Tencent. Microsoft’s value at its height during the dotcom boom was around 8 times its sales value and the highest Apple ever reached was 6.54 in 2007.
How do these market valuations link to relative Cash ROAM numbers?

Does this chart show that the value of a listed company is determined far more by short-term market sentiment and views of market sectors than the company itself?
Take Amazon – a customer-focused ATO and ROAM exemplar. It is a brilliantly designed and managed cash compounding machine. By Slywotsky’s measure it comes near the back of the field even with a 27% Cash ROAM.
Does this show that, like the dotcom period, there’s a gale force, on-shore wind pushing up a high tide of expectations for Tencent’s and Facebook’s market sectors?
Given its Cash ROAM%, what if Tencent’s multiple fell back to the level of Google, Amazon, Microsoft and Apple? Is that possible? Probable? What would it mean for Naspers’ valuation, its management, employees and shareholders?
These charts raise some critical questions. If the firm is being overvalued – which it may or not be – either way, some “Corporate Marketing” is in order.
The management team should start with an 80/20 diagnosis of its business units and explain more facts behind the figures during its road shows and reporting. Otherwise, when the wind drops and the tide turns, will it be a spring, or neap one?
Management can influence the outcome by communicating the full benefits of good news; avoiding extravagant claims and forecasts; revealing the bad news and explaining how to correct and avoid it in future; giving more segmental detail that includes the assets – not just Sales Revenue and profits. Doing that would go a long way to explaining the facts behind the numbers.
It will also tell us if Bob van Dijk and his team will be happily splashing around wearing swimming costumes when the tide goes out, or standing naked – as Didata’s team did in 2001 when the value was swept away by the outgoing tide.
- Ted Black’s career has taken him to Sierra Leone, Malaysia, the UK and South Africa. He has been a teacher, rubber planter and held senior positions in organisation development, general management as well as being a director of companies. Today, he acts as mentor and coach to executives and managers. Using the ROAM model (Return-on-Assets Managed) to pinpoint opportunity, he helps them design high-precision, results-driven projects. These turn strategy into action, and grow managers and their teams fast and measurably – the prime goal. He has published three books. “The Red Bead Game” (based on Deming’s work), “Who Moved My Share Price?” (Co-authored with Professor Andy Andrews). The last in 2011, co-authored with Richard Pike (CEO Adcorp) and Loane Sharp (Economist), called “The New Divide” addressed the issue of South Africa’s unemployment problem and the huge “problem/opportunity” this poses.
Read Fin24's top stories trending on Twitter: Fin24’s top stories


